automation
View the Project on GitHub DataDrivenEcologicalSynthesis/automation
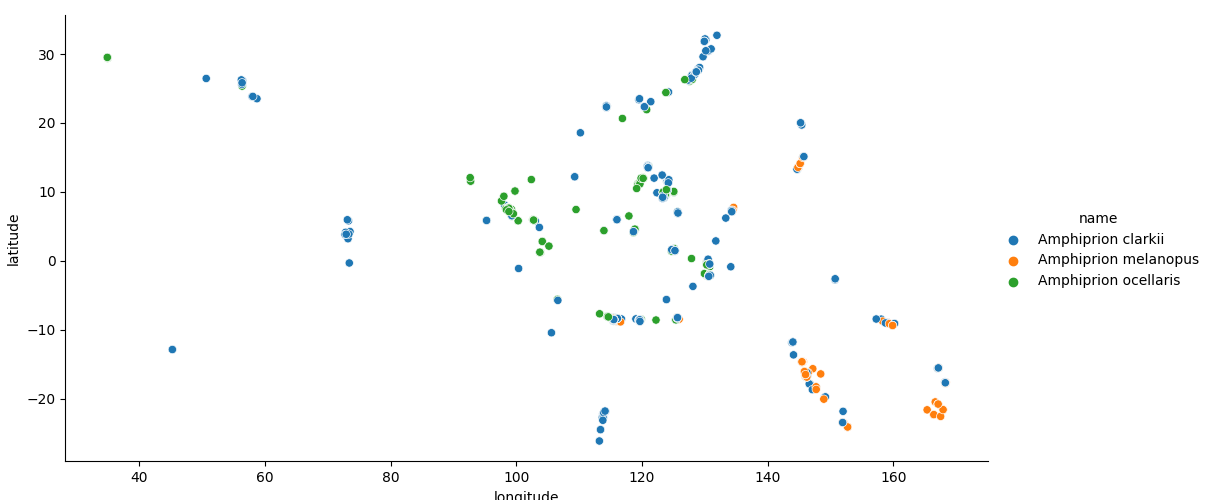
Map of Amphiprion occurrences
How to create the figure
This figure is produced through the following steps:
- using
GBIF.jlto get the GBIF data on the occurrence of the genus Amphiprion - using
matplotlibto visualize them – the map is color-coded by species name - publishing the result through github pages
All of these steps are independant, and only “communicate” using artifacts. The entire pipeline runs once a week (monday at midnight), on every push to the master branch, and on every pull request - this ensure that the results remain up to date both with regard to changes to the data, and to changes to the code.
See the underlying data
You can find a link to the data here: occurrences.csv